
A Swedish non-profit
A space for learning about the world.
We make public data understandable for everyone. Right now we do that in two ways: data journalism about Sweden, and a programme that teaches students to report with data.
Sverige i siffror
Data journalism about Sweden
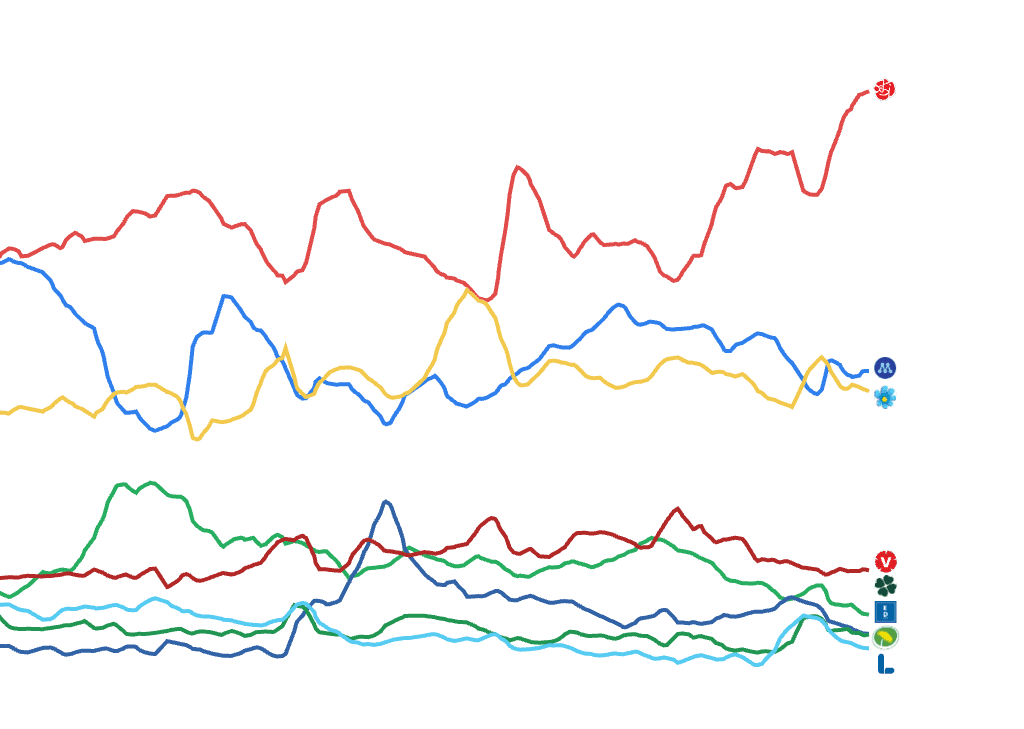
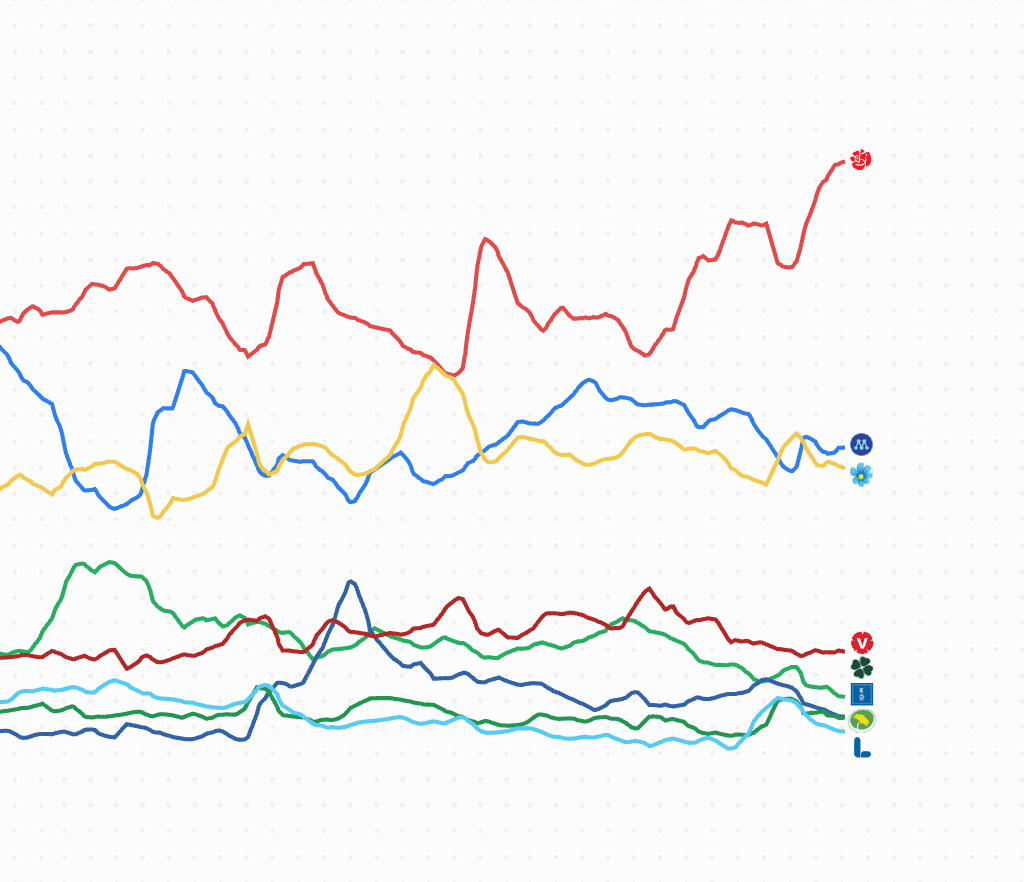
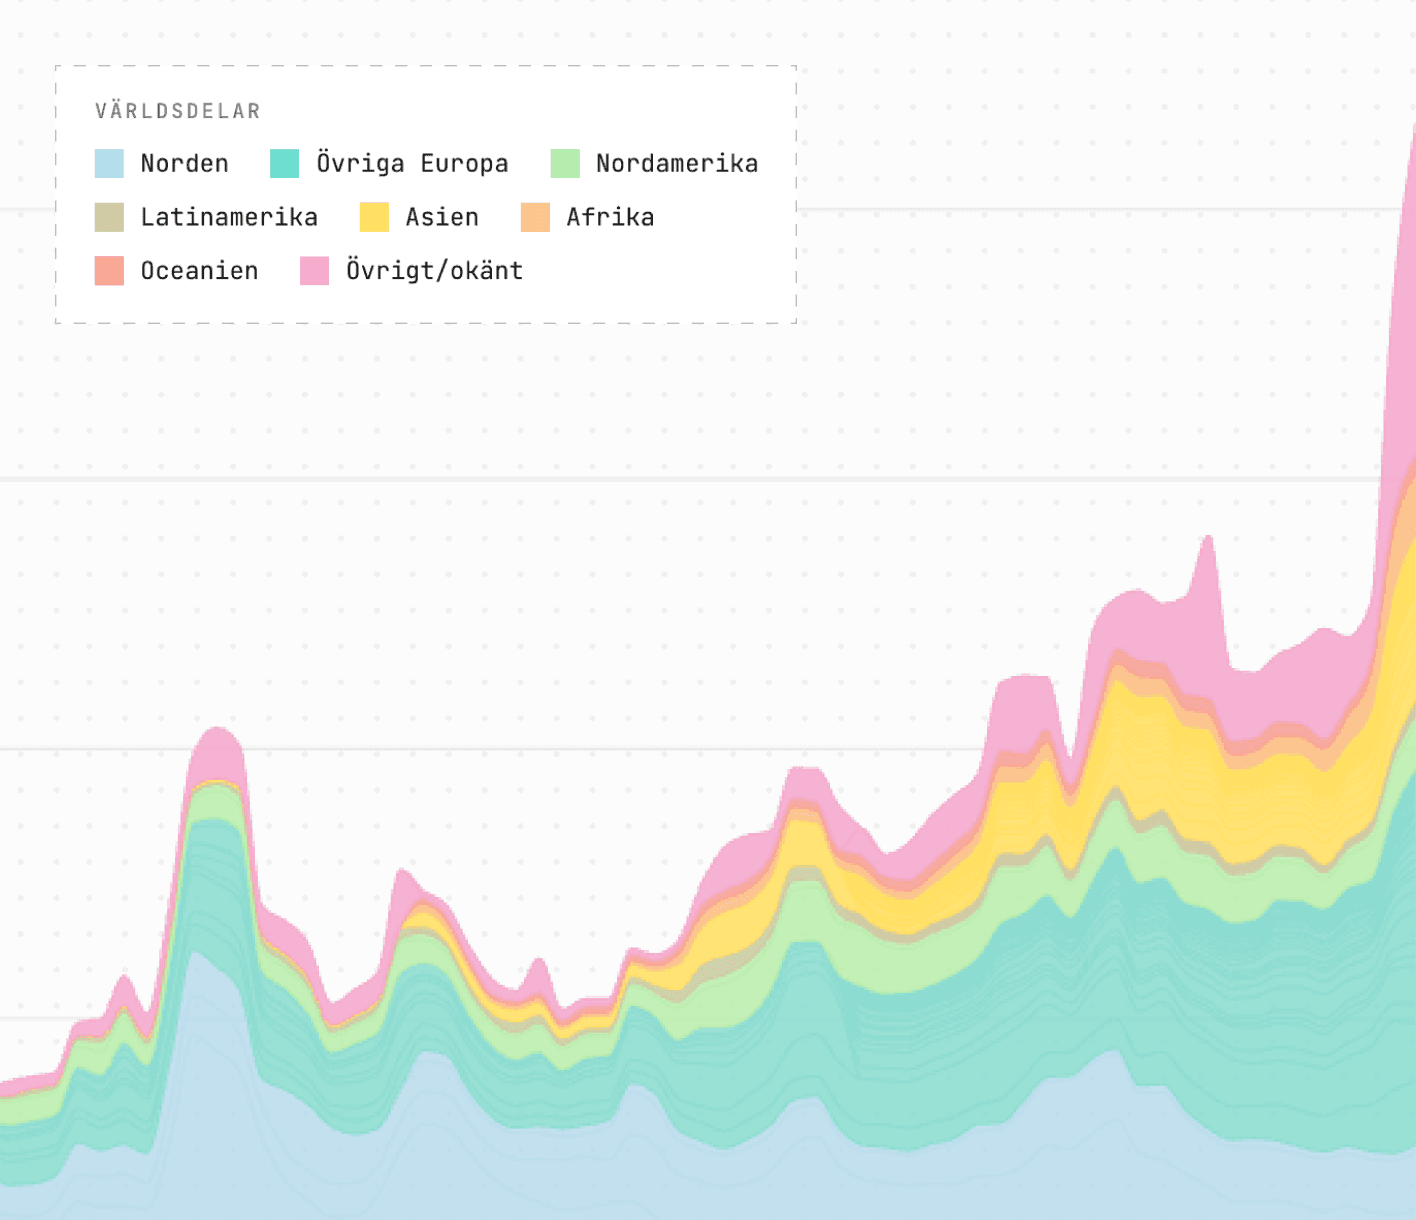
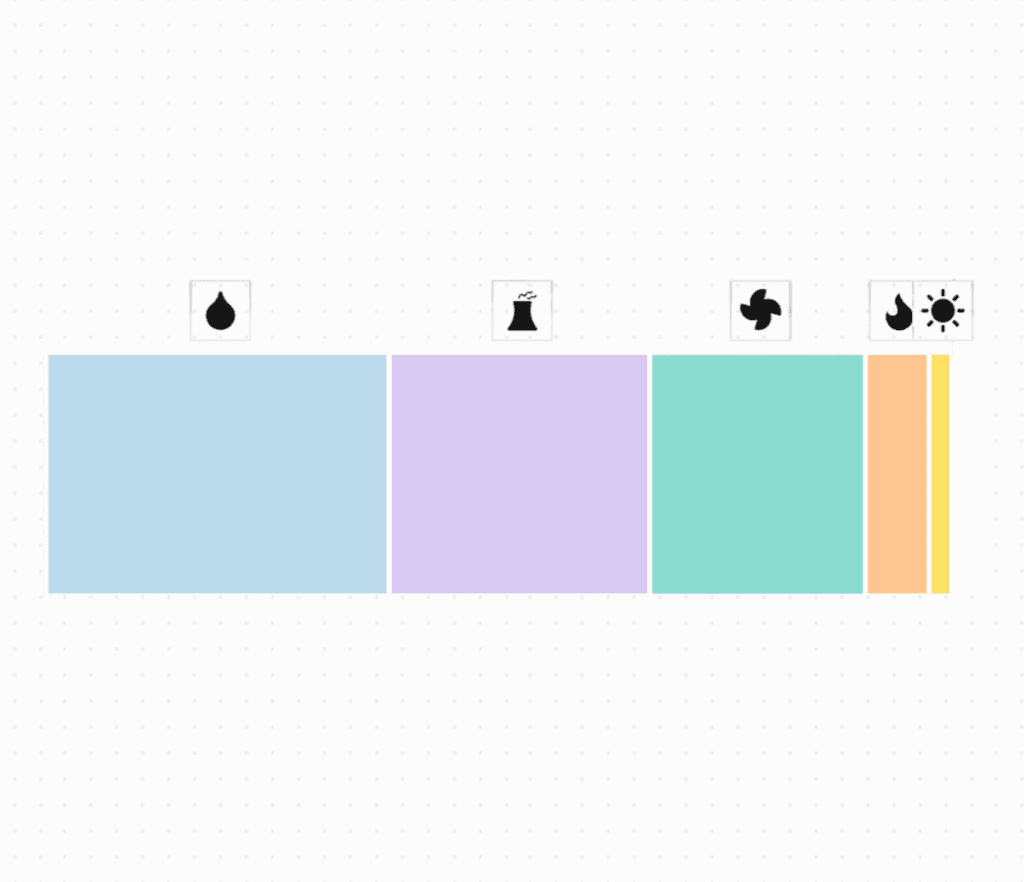
Interactive tools and stories built on official Swedish statistics: how people vote, where they come from, what they earn and where they live. You can filter, zoom and search in every chart.
Freefor schools and teachers
Datastory Academy
Teaching students to report with data
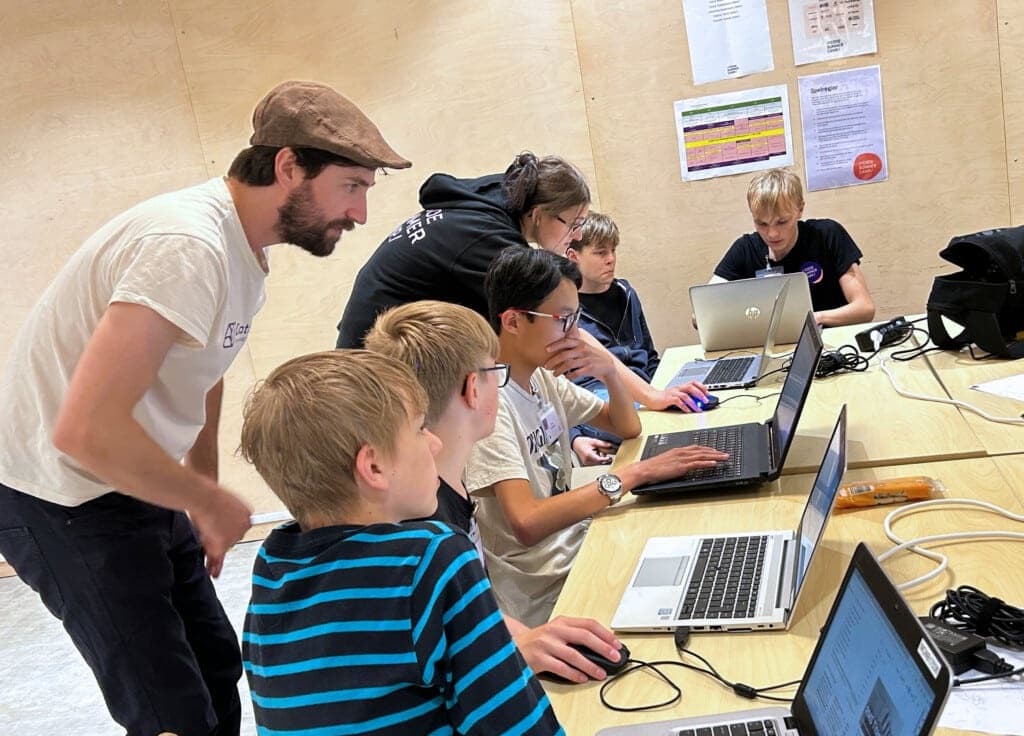
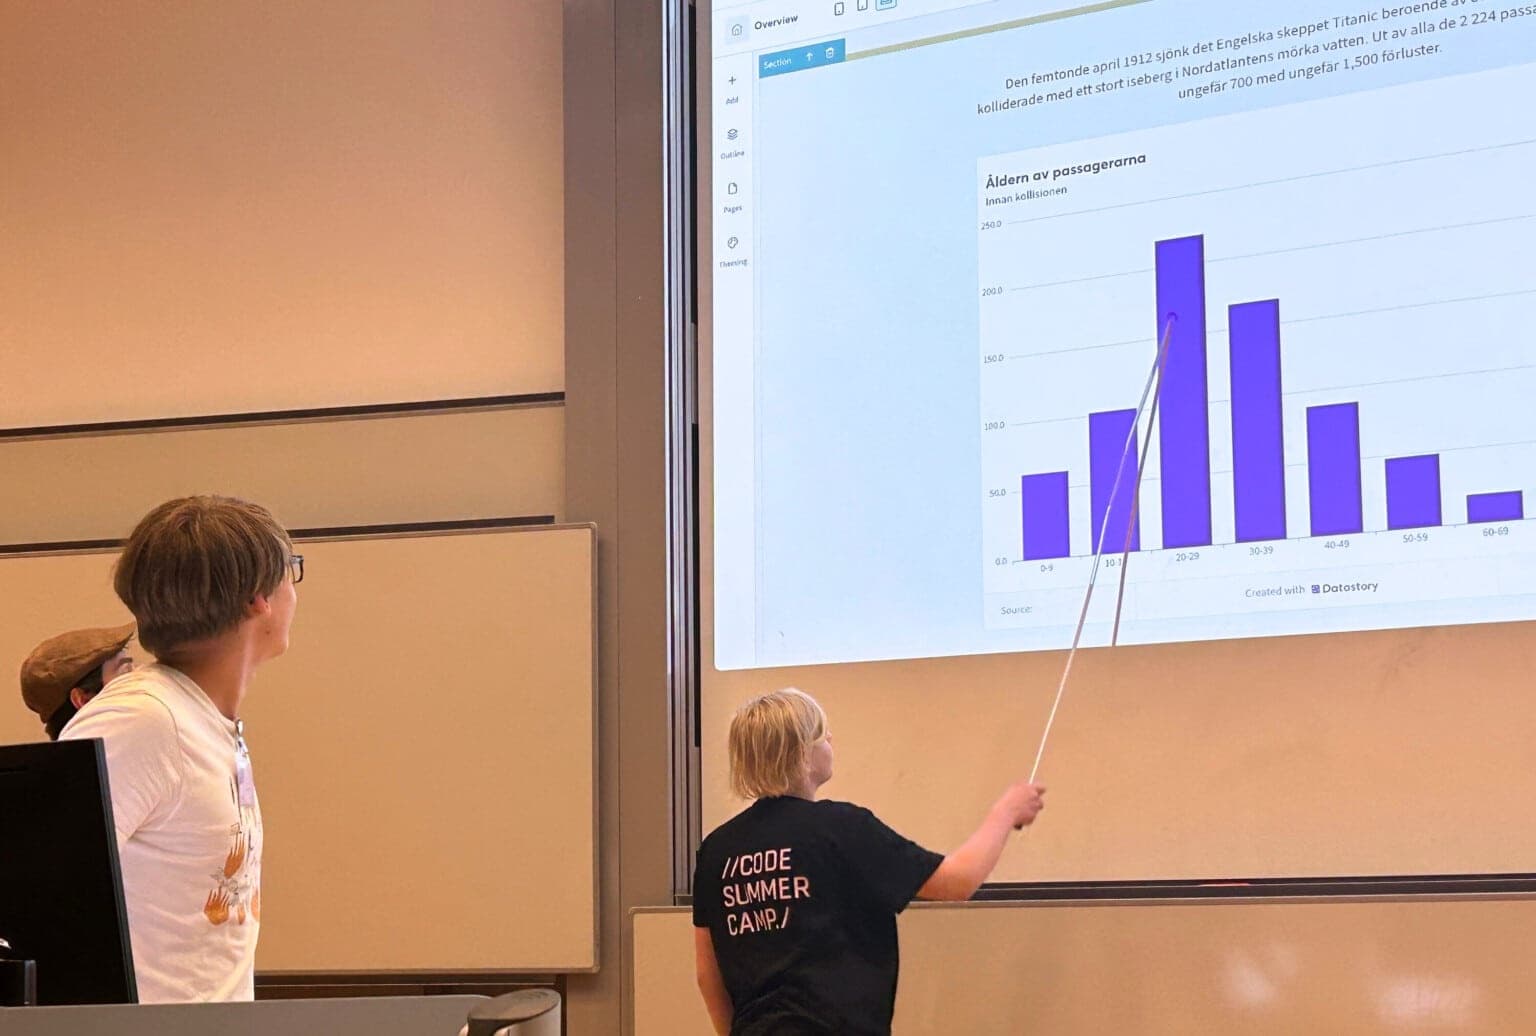
Students pick a question, find open data that answers it, build charts and publish a story, using the same tools newsrooms use. Teachers get lesson plans, datasets and classroom accounts for free.
 Datastory, the platform
Want to visualise your own data?
The tools behind everything on this site are made by Datastory Tech AB, a separate company. Build charts, stories and whole websites from your data, or browse thousands of open datasets.