Looking to visualise your own data?Go to Datastory, the platform →
Datastory Academy

Teach data journalism with real data.

We give classes free access to the Datastory platform, which newsrooms use to turn open data into charts, maps and stories. We also provide ready-made exercises to get you started.

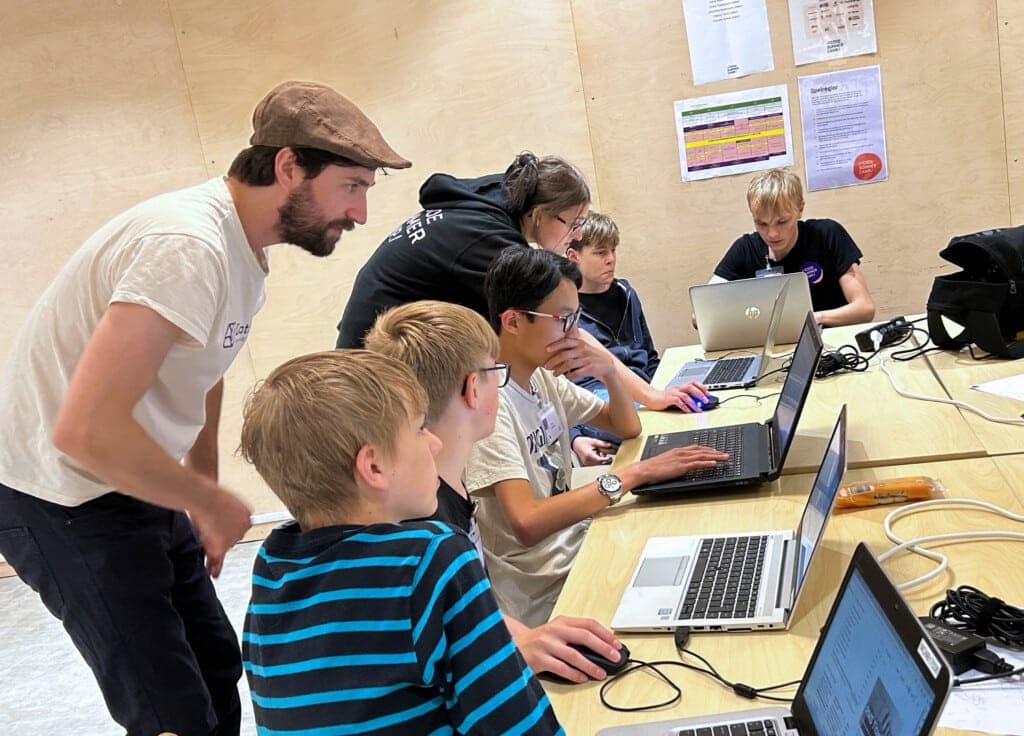
Students working with data
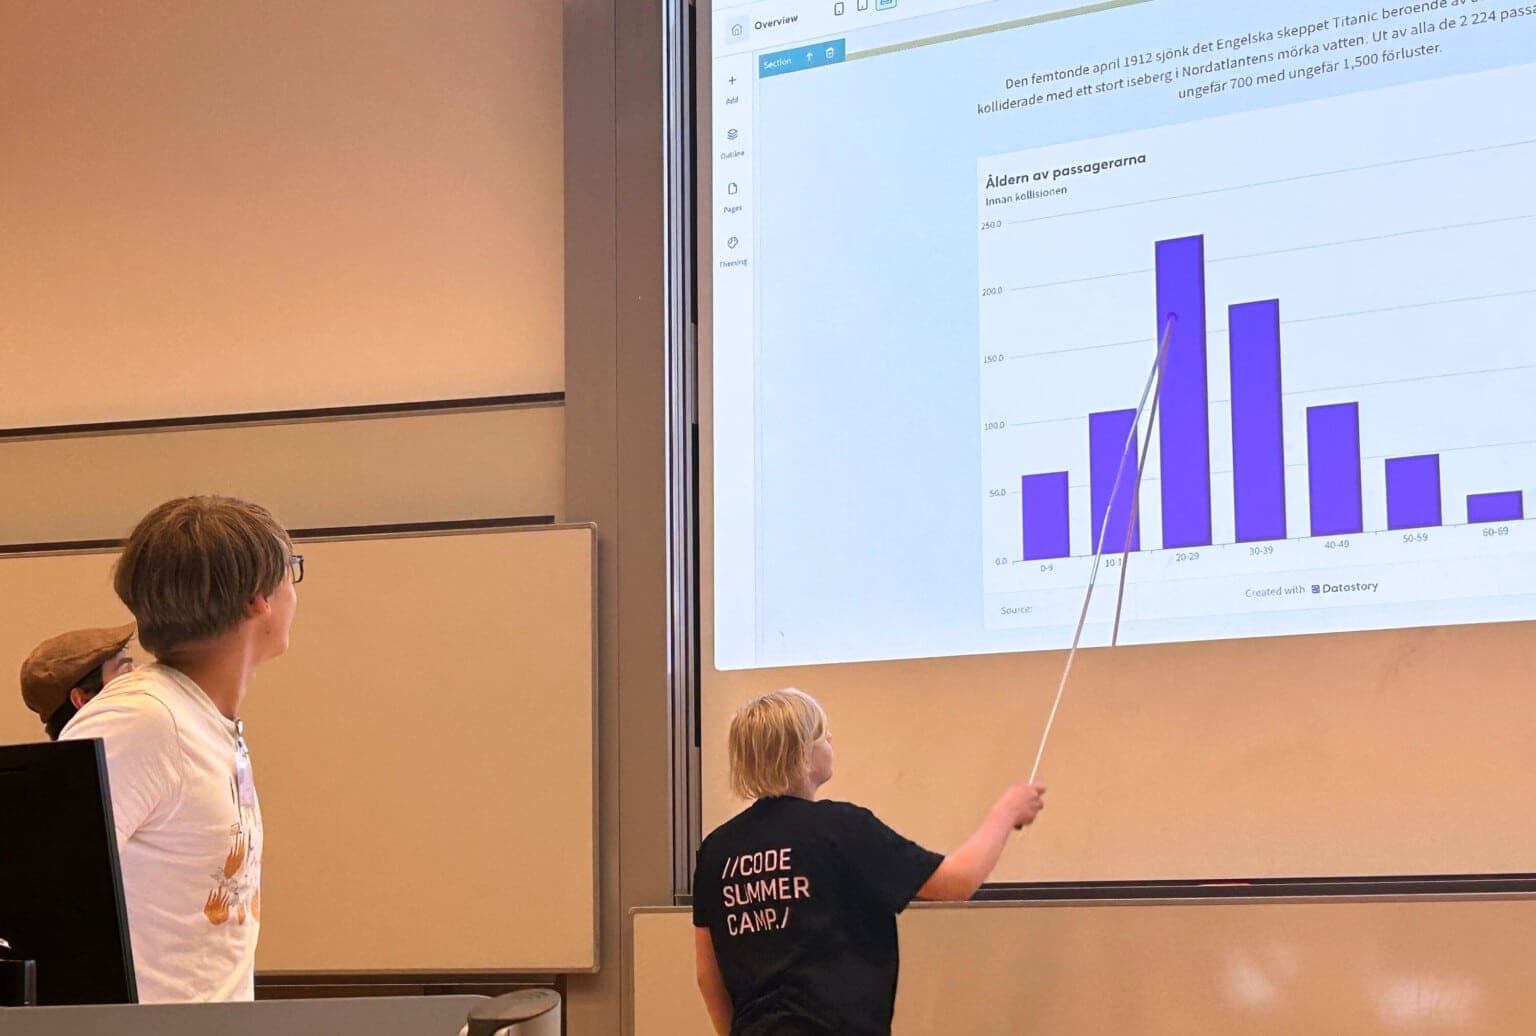
Student presenting a chart
Free for classrooms

How free accounts work

Datastory.org is a non-profit. We pay for Datastory platform accounts for primary and secondary schools, so no class has to miss out on working with data because of the cost.

  1. Email us. Tell us your school, the course and roughly how many students you have.

  2. We set up a classroom workspace. You get a teacher account and student seats within a few working days.

  3. Start with an exercise. Pick one below, or bring your own dataset. Each student's work is published online at its own address.

Contact us

Want to use Datastory with your class?

hello@datastory.org
  • Free for primary and secondary schools
  • Easy to get started
  • Includes access to open data
Exercises

Three ways to start

Each exercise ends in a published story and comes with a teacher guide. Use them as written or as a skeleton for your own.

Students collecting data
Beginner

Local journalism

Report on your own school, street, or town with data the students gather themselves.

  1. Choose a local question and design a short survey or count
  2. Collect your own data and enter it in a Datastory dataset
  3. Use the newspaper template to lay out headline, chart, and text
  4. Publish and present to the class
Request the teacher guide →
Intermediate

Visualise climate and energy

Work with open data on emissions and electricity to explain how a country's energy mix is changing.

  1. Find the climate and energy datasets in the open data catalog
  2. Build a line chart of emissions and an area chart of the energy mix
  3. Compare two countries and write what the difference shows
  4. Publish as a short data story with sources cited
Request the teacher guide →
Intermediate

Build a country profile

Each student picks a country and builds a one-page profile: people, economy, environment, and one surprise.

  1. Pick a country and filter the World Bank and UN datasets to it
  2. Create four charts, one per theme, using the country profile template
  3. Add a map and a headline number for each section
  4. Publish and compare profiles across the class
Request the teacher guide →

Questions about the programme?

Write to us at hello@datastory.org and we'll help you plan a term.

Email hello@datastory.org